Your Ultimate Guide to KPI in B2B Industry in 2023
What is Key Performance Indicator (KPI)?
Key performance indicators (KPI) are metrics that can be used to measure and track progress toward a certain end goal. Key performance indicators are used to assess how well a business is doing so that improvements can be implemented based on hard data.
Key performance indicators (KPIs) provide teams with something to shoot for, checkpoints to evaluate their progress, and information to assist direct decision-making across an entire business. It gives teams targets to aim for, benchmarks against which to measure their success, and data with which to advise and steer business-wide decision-making. By keeping tabs on key performance indicators, businesses may assess where they excel and where they could use improvement. It allows firms to evaluate their strengths and areas for growth.
Let’s try to understand KPI through an example:
A key performance indicator (KPI) is a target that you strive to reach. Let’s presume for the purpose of explaining that you run a toy stall and that in order to turn a profit this month, you need to sell 1,500 toys.
So, you decide on a Key Performance Indicator: sell 1,500 toys this month. Your key performance indicator is to sell 1,500 toys, whether that means 375 products per week or all 1,500 toys in the first three days. If your key performance indicator shows that you have sold 750 toys by mid-April, you know you are on track to meet your objective.
How Should Effective Key Performance Indicators Be Constructed?

Ideally, a key performance indicator (KPI) would be something that can be measured in a clear manner. Here are a few things to bear in mind while determining which metrics to use.
- KPIs should be in alignment with the objectives of the company as a whole. Your key performance indicators should reflect your overall business strategy. A high-level KPI might be an increase in Monthly Recurring Revenue (MRR) by 20% at the end of the fiscal year. A low-level key performance indicator for a sales team member could be to double the number of qualified inbound leads by the conclusion of the third quarter. Because new leads equal revenue potential, your KPI helps the company reach its objective.
- KPIs should be practical. After settling on a key performance indicator, it’s time to map out the actions you’ll take and the metrics you’ll track to get there. If there is no way to achieve a key performance indicator, what is the point of having one? To achieve your objective of generating inbound leads, you will need a strategy to convert more of your leads from the marketing qualified lead (MQL) to the sales qualified lead (SQL) stage. To achieve your key performance indicators (KPIs), you need a plan of action. It’s important to remember that KPIs are meant to motivate action, not more questions.
- KPIs must be rational. The advice to “go small” is sound. While ambitious, impractical KPIs may look fine on paper, they do neither you nor your team any favors in practice.
- KPIs must be quantifiable. Consider your end goal(s) carefully before settling on a set of KPIs. Which outcome do you hope to see? Timeline, please. Don’t forget to include a section on your key performance indicators and how you plan to track them. Using a business intelligence (BI) or analytics tool is often highly effective for monitoring key performance indicators. This allows you to easily and rapidly see your progress in data visualization as you construct a measure (like leads) and share it with others on your team or throughout your organization.
Best KPI Marketing Strategy for B2B
Client Acquisition
This key performance indicator measures how many new paying clients you’ve attracted in a specified time period. This key performance indicator could be improved by counting only customers who were brought in with the help of marketing (i.e., the number of customers who were exposed to at least one piece of advertising before making a purchase).
ACV = Value Created By An Average Customer
This key performance indicator measures the average lifetime value of a customer.
When marketers calculate the lifetime value of a customer, they have a better idea of how much money they can count on making off of each consumer they bring in. A company’s return on investment can be calculated.
The Ratio of Paying Leads
This key performance indicator measures the ratio of qualifying leads to closed deals. The Corporate Finance Institute suggests the following method for determining this:
The percentage of qualifying leads that turned into sales can be calculated as follows:
A 10% lead-to-customer conversion rate, for instance, would be achieved if 100 of 1,000 qualifying leads generated in a particular time period were converted into paying customers.
Using this statistic, B2B companies can estimate how many quality leads they need to get one paying customer.
Produced MQLs and/or SQLs
These key performance indicators measure how many marketing- and sales-ready leads a campaign has produced. Marketing-qualified leads have already demonstrated an interest in your company by reading a service-related page or downloading a piece of lower-funnel content.
Customers that have expressed serious interest in doing business with you by filling out a “Contact Us” form are examples of sales-qualified leads.
What constitutes a “marketing and sales qualified lead” varies from firm to firm. These indicators can help you predict which leads will convert into customers and evaluate the quality of the leads your marketing efforts are generating.
Report on Current Life Cycle Stage
This key performance indicator is measured by the rate at which leads are converted into paying customers.
Use this report to keep tabs on how many individuals are in each stage at any given time, how many leads have been turned into customers, and how many leads you may expect to convert in the near future.
Reports from Multiple Sources and Mediums
This key performance indicator refers to the information readily available in the “sources” section of Google Analytics and comparable reports on other website analytics platforms. A user’s journey to your site can be broken down into two categories: source (the specific channel) and medium (the broader channel that the source is a part of). If a user discovered your site through a Google search, for instance, Google (the name of the search engine) and Organic (meaning unpaid search) would be their Source and Medium, respectively.
You can see exactly what kinds of traffic, conversions, and revenue each channel is responsible for by looking at these data.
Profitability Analysis of an Ad Campaign
With this key performance indicator, you can assess the profitability of your advertising strategy. If you paid $2,000 on Google search ads for a month and made $5,500 in income from those ads, your return on investment (ROI) is 5.5.
If your company has a lengthy sales cycle, this is a great way to estimate your return on investment (ROI).
You can estimate an 8.5-9.5 percent return on investment (ROI) for your $2,000 Google Ads campaign if it generates three SQLs and you know each SQL is worth $3,500 to your business.
Customers (leads | MQLs| and SQL’s) most popular viewing pages
The most popular pages on your site, as determined by visitors and various lead types, are the focus of these key performance indicators.
Customers who have already made a purchase are the most valuable to keep tabs on if your database is huge. If you don’t already have a sizable client base, you can still monitor the content that your leads view. You can see how far down the path to converting your leads are by keeping an eye on these indicators.
How To Measure Company’s KPI?
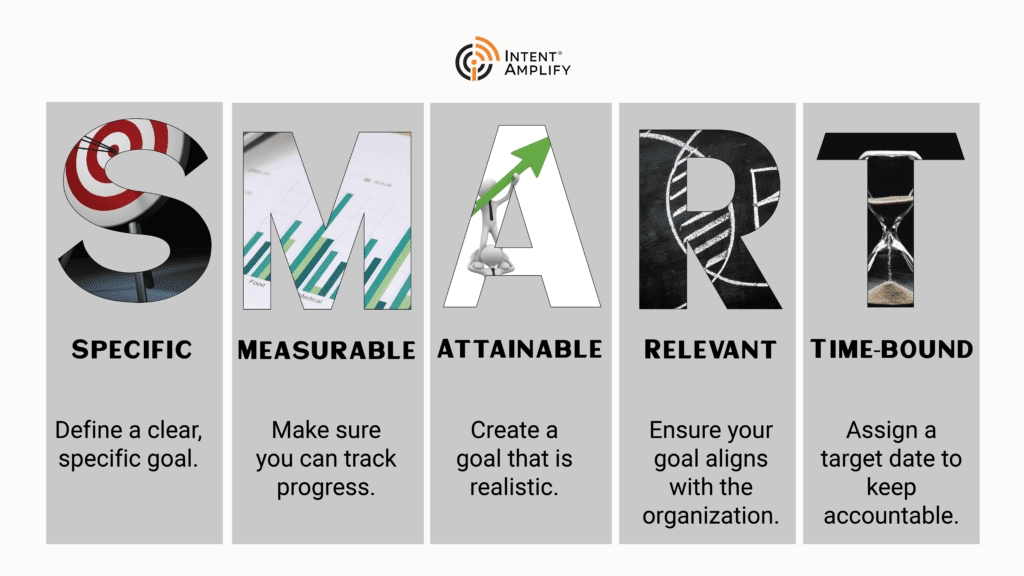
After knowing about the basics of KPIs and their strategies the question, “How do I measure my company’s KPIs?” may arise. Don’t worry we have a solution for that concern as well! SMART Framework! It can be used to evaluate the success of your key performance indicators.
SMART goals are ones that can be defined, measured, prioritized, and completed within a predetermined time frame. So, to decipher the SMART (Specific, Measure, Attainable, Relevant, Timeframe) acronym, we need to know a few questions and keep that in mind:
- Is there a clear end goal in mind?
- Is there a way to track how far you’ve come?
- Is it possible to achieve this objective?
- How important is this objective to your group?
- When do you anticipate finishing this?
Adding evaluation and re-evaluation to the measurement stages of the SMART framework makes it SMARTER. Key performance indicators (KPIs) should not be set in stone; rather, they should be regularly reviewed to ensure they remain realistic and on track.
Wrapping Up!
It is essential to choose the key performance indicators (KPIs) that are most pertinent for your marketing campaign if you want your B2B marketing goals to be realized. Last but not least it can provide you with concrete numbers to show for your efforts, which is useful if you are feeling confident about them to your supervisor or coworkers.
Don’t worry if you’re not confident or sure about how this works. We at Intent Amplify with our in-house professionals will assist you in realizing your realistic KPIs and help you in streamlining your conversion rate throughout your full-funnel sales marketing campaign.