In business environments, people often consider KPIs and measurements identical. However, while they function similarly, they serve different purposes. Simply keep this statement in mind for the future: all KPIs are measurements, but not all measurements are KPIs. Consequently, this post will discuss the fundamental distinction between Metrics and KPIs models and suggestions for executing them effectively.
Let’s understand the term’s definition first!
What Are KPIs?
KPIs, or key performance indicators, are measures used to monitor development toward a target. In order to make informed decisions about where to focus attention and resources, businesses utilize key performance indicators to measure their success.
Goals, benchmarks for measuring success, and data to support strategic decision-making are all made easier with the help of key performance indicators (KPIs). It provides teams with goals to work toward, standards against which to evaluate performance, and information to guide and advise company-wide decision-making. Key performance indicators allow firms to evaluate their strengths and areas for growth. In this way, businesses may assess their current state and plan for the future.
What Are Metrics?
Metrics are measurable data used to monitor the performance of specific operational and tactical business processes. They are not as vital to the fulfillment of core business objectives as key performance indicators, but they help provide context for their performance.
Metrics are not the essential index to surveilling strategic actions though they might be closely related to the business objectives. Nonetheless, they continue to notify businesses about the progress of their various activities. Lead-to-Conversion-Ratio, Return Rate, and Acquisition Costs by Marketing Channel are examples of metrics.
Now that we have a basic comprehension of the definitions of KPIs and metrics, let’s examine the distinction between the two.
Correlation Between KPI & Metrics
What’s important is that KPIs aim to achieve their intended purposes. Any activity that we can correlate serves as a measurement. We closely connect key performance indicators and metrics. In contrast to metrics, which can exist without an objective, KPIs necessitate more deliberate consideration of targets.
According to ClearPoint Methodology’s creator, Ted Jackson: “In its most basic structure, a KPI is a kind of presentation estimation that helps you understand how your association or division is performing. The right key performance indicator (KPI) should act as a compass, helping you and your team understand whether you’re following the right way toward your essential objectives.”
Key performance indicators (KPIs) should have a focus, a specific time span for achieving the goal, and be relevant to business outcomes. All of the aforementioned may be included in a set of measurements.
Let’s headfirst into the differences.
What is the Difference Between a KPI & Metrics?
Both key performance indicators and measures are quantitative hypotheses, although their focus differs. Key performance indicators (KPIs) are linked to the goals of your company, whereas metrics are linked to the processes you use to achieve those goals.
The two commonly overlap, which is why the general public is usually confused about which is which. Using one or more metrics, a key performance indicator (KPI) indicates how close a company is to achieve its goals.
If you want to sell 50-60% more products/services next quarter, for example, the number of services you’ve offered so far can be your most important presentation metric. However, the most important KPIs will typically include a variety of metrics, such as:
- How many people visit your website regularly.
- Your application’s/website’s user experience.
- Each channel’s individual sales.
Looking at these numbers gives you a sense of how far along you are on the road to achieving your business goal, but it’s not the whole picture. You can see which areas are most helpful in reaching your overall goals and where you’re experiencing the most difficulty.
Also, metrics are often owned by a single department or office, but key performance indicators (KPIs) are sometimes shared among several departments and individuals. If a company’s goal is to increase service sales by 30% in the first quarter of 2023, for instance, many departments could be working toward that end:
- Your key performance indicator in advertising could be a 50% increase in your website traffic.
- Improvements to products will center on incorporating more practical features.
- The result of the creative effort will be novel components added to the existing chaos.
- Limits and improvements that will increase modifications should be offered in contracts.
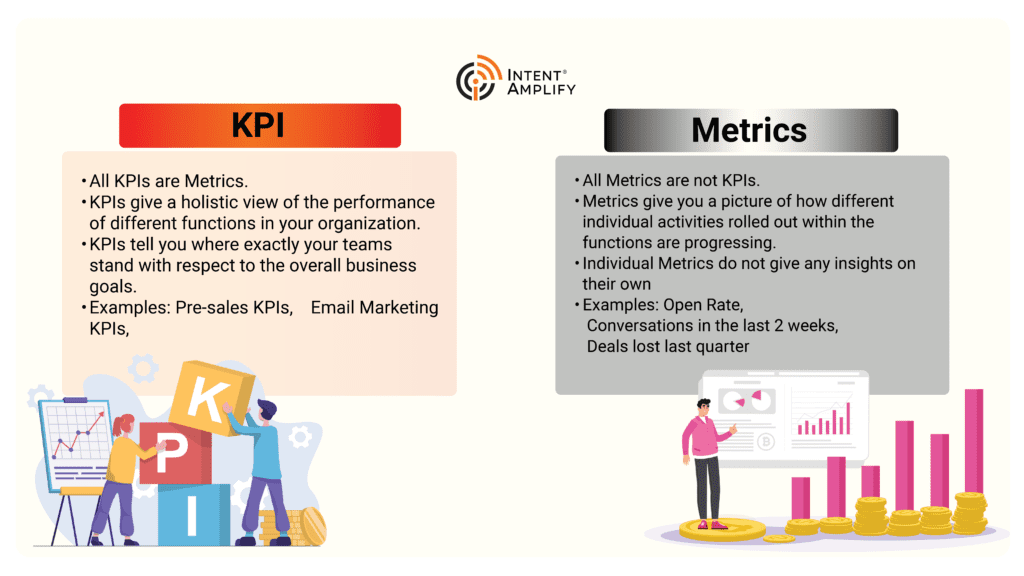
All KPI Are Metrics But All Metrics Are Not KPIs

If we imagine metrics to be the individuals that make up a clan, then the KPI would be the collective goal of the clan as a whole. Everyone in the community plays a part in working toward the goals it has set for itself.
Metrics such as customer acquisition price, clickthrough rate, and goal conversion rate are the building blocks of this group. This data is what backs up your key performance indicators.
However, the KPI is the end goal. Key performance indicators are the most essential metrics, as they reveal the true nature of your business’s most essential aims. This clan is preventing the other squad from completing their mission. And you can’t do that without a strong team of metrics (or people) behind your key performance indicator.
Measuring KPIs & Metrics The Right Way
We discussed what key performance indicators (KPIs) are and how they differ from other types of business metrics. We’ll go over some right ways that will help you estimate your goals and carry them out effectively in the next section of the piece. To begin:
Differentiate between KPI and Metric
Do not merge your company’s KPI and Metrics. If you try to estimate everything, you end up estimating nothing. You should think about what is typically important for your firm when separating KPIs from metrics. You can use any indicator as a gauge, but you shouldn’t keep one that isn’t providing useful information to spur your development.
Inappropriate standards can lead to pointless effort that can be avoided with a little forethought. Overestimating can be baffling and misleading. Avoid this by focusing on the key performance indicators (KPIs) that matter most for achieving your goals and discarding the rest.
Appropriate Key Performance Indicators
Choosing appropriate KPIs to monitor is a crucial first step in effective strategy tracking. Some key performance indicator tracking strategies can be of use in this regard. Two of these approaches which will assist you in choosing appropriate KPIs are a SMART framework and the 6 A’s. Let’s dig in to see how they offer us the right approach:
SMART is an acronym for “Specific, Measurable, Attainable, Relevant, and Time-bound”, which describes the criteria for key performance indicator tracking. It serves as a checklist to ensure that your key performance indicators are actually helpful. As has been stressed throughout this piece, they need to be tailored to your objectives, grounded in the realities of your organization, and adaptable as your strategies develop.
6 A’s namely, Aligned, Attainable, Acute, Accurate, Actionable, and Vibrant are the six pillars upon which this methodology rests. This method, like the SMART criterion, seeks to analyze a KPI’s relevance and can help firms that are overwhelmed by data and need to focus on just a handful of metrics.
Using these techniques, you should be able to identify 2–5 crucial KPIs for each business objective. Because of this, you can maintain the integrity of your analysis process and shield yourself from potentially misleading information.
Remember that reviewing your key performance indicators frequently is essential. Make sure you are keeping tabs on the proper information if you have discovered a more efficient method of reaching your objectives. To do this, you should compile weekly or monthly reports detailing your key performance indicators. After settling on a set of key performance indicators, you’ll have all you need to plan forward effectively.
Focus your attention on a user-friendly dashboard
Key performance indicators and other forms of business metrics are valuable tools. Metrics are useful for getting a more complete picture of a division’s or region’s performance, even if key execution indicators are normally more important. Several modern web-based data visualization tools provide a variety of dashboard layouts for visualizing KPIs and metrics.
Avoid vanity metrics
Metrics that look good on paper but don’t actually help guide future business decisions are known as “vanity metrics.” Sometimes “vanity metrics” are used to demonstrate progress when, in reality, they are meaningless and unrelated to anything substantive. Those who use Social Media are a remarkable example of a vanity metric. Let’s pretend you did something that resulted in 15,000 new Instagram followers. Now this may appear to be a success at first glance, but if only 50 of those 15,000 followers really end up purchasing your products/services, the metrics become meaningless.
You should be as objective as possible in your analysis so as to avoid having to deal with the problem of vanity metrics. Make sure the key performance indicators and metrics you choose to track are reasonable. Statistics like fan count or music preference graphs may look encouraging, but they may be misleading at the same time. Various key performance indicators (KPI) and dashboard styles are available in business intelligence tools that help point you in the right direction so you can avoid making this mistake.
Create practical goals
Setting practical goals is the final step in accurately measuring metrics and key performance indicators. Knowing your destination allows you to estimate your key performance indicators and other data accurately. Here, you need to be cautious so as not to establish unrealistic goals, such as a 60% increase in sales in a year when your usual increase from the prior years has been around 6-7%. When establishing objectives, it’s important to keep reality checks and basic industry standards in mind. Setting reasonable standards for your company will help you avoid feeling overwhelmed or discouraged while you pursue your business goals.
Wrapping Up!
As we wrap up this article, we hope you have a clearer idea of the differences between Key Performance Indicators and Metrics. Remembering that key performance indicators (KPIs) and metrics are fundamental to guarantee a solid return on investment from your various business activities is the most important takeaway from this article.
Key performance indicators and metrics are useful tools for monitoring actual work being done. More and more businesses are turning to business intelligence dashboard development in order to gain a holistic view of their most critical metrics in an intuitive and efficient format. Having access to modern dashboard technology helps teams stay connected and work together to achieve common business goals.
To learn more about our KPI and metrics services, visit us at intentamplify.com