
RESEARCH PREMISE
Supply chain performance is commonly measured through service, cost, inventory, forecast, and operational metrics. Those measures remain essential, but they do not directly reveal how quickly an enterprise converts a material change into an executed response. In a volatile environment, that missing measure matters. A business can have strong visibility and still react late. It can have sophisticated analytics and still spend hours reconciling context. It can make a decision quickly and still lose days in execution.
This report proposes decision latency as a management framework. It does not present an external market benchmark or invented industry average. Instead, it defines a repeatable method that enterprises can use to establish a verified internal baseline from their own operational evidence.
EXECUTIVE FINDING 1: RESPONSE SPEED IS AN END-TO-END SYSTEM PROPERTY
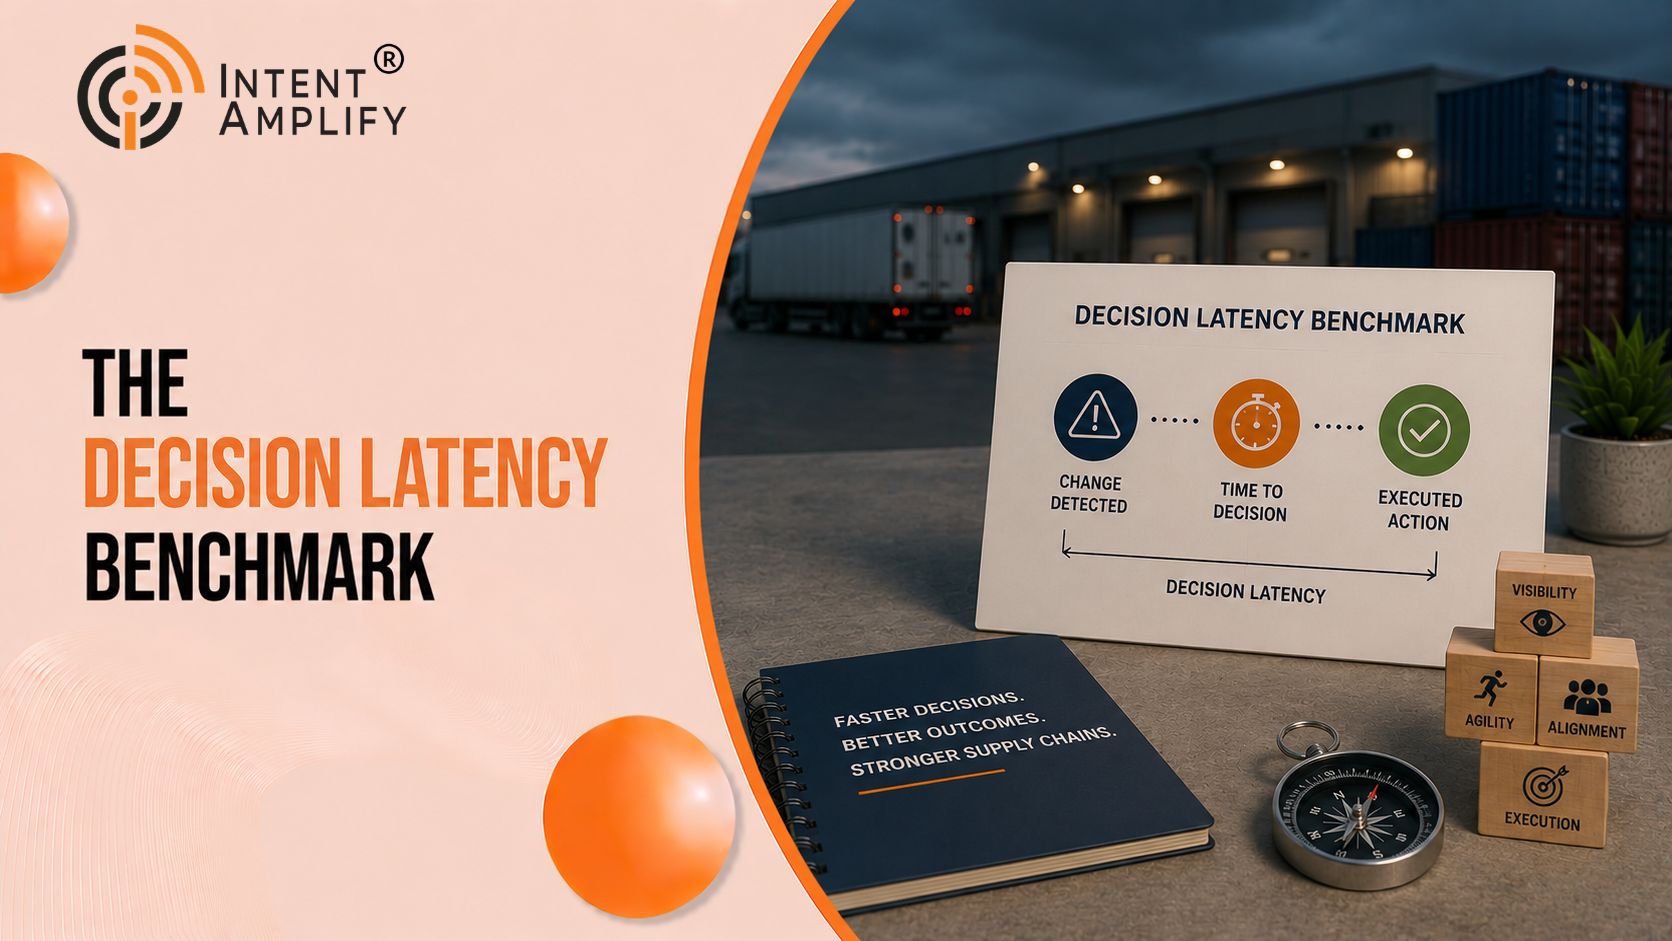
Response time should not be reduced to the speed of a planning meeting. It begins when a meaningful signal becomes available and ends when the selected action is operationally committed. Between those points are several forms of latency: detection latency, context latency, ownership latency, decision latency, approval latency, and execution latency.
Executives should measure these stages separately. A single “time to resolve” metric can hide the actual constraint. If most delay occurs before an owner is assigned, better analytics will not solve the problem. If the decision is made quickly but execution waits for system changes or partner confirmation, the organization has an execution problem rather than a decision problem.
EXECUTIVE FINDING 2: VISIBILITY SHOULD BE MEASURED BY THE TIME IT CREATES
Supply chain visibility is valuable when it creates usable time. The relevant question is not simply whether a milestone or exception can be seen. It is whether the information arrives before the last useful decision point.
A decision-latency baseline should therefore capture two timestamps: when a reliable signal first became available and when the organization first acted on it. The difference reveals how much of the available response window was consumed internally. This is particularly useful for origin visibility, where earlier detection may preserve routing, mode, inventory, prioritization, or customer-management options.
EXECUTIVE FINDING 3: CONTEXT ASSEMBLY IS A MAJOR DESIGN VARIABLE
When supply chain data is fragmented, teams spend time assembling the decision case. They identify affected orders, inventory, suppliers, customers, locations, commitments, and constraints. That work is necessary, but it should not be rediscovered from scratch for every exception.
A strong data layer reduces context latency by connecting operational events to business exposure. The objective is not more dashboards. It is faster shared understanding. Leaders should test whether a material exception can be linked quickly to the objects required for a decision: what moved, what changed, what is exposed, what choices remain, and what each choice requires.
EXECUTIVE FINDING 4: OWNERSHIP LATENCY IS MEASURABLE
Decision ownership is often treated as an organizational topic rather than an operational metric. It can be measured. For each recurring decision class, record the time from validated exception to accountable owner. Where that interval is consistently long, clarify authority and escalation rules.
The highest-value decision classes are those that are frequent, consequential, time-sensitive, and cross-functional. Examples may include capacity constraints, route changes, inventory reallocations, customer prioritization, supplier exceptions, or service-recovery choices. Organizations should select their own classes from verified operating history.
EXECUTIVE FINDING 5: AI SHOULD REDUCE SPECIFIC FORMS OF LATENCY
AI for supply chain decision making should be evaluated against explicit workflow outcomes. Can it shorten signal triage? Can it assemble relevant context? Can it compare scenarios? Can it surface constraints or dependencies? Can it document the rationale for a decision?
This approach avoids vague claims about autonomy. AI is useful when it removes low-value search and synthesis work while preserving appropriate human accountability for material decisions.
THE DECISION LATENCY MODEL
The proposed model contains six intervals.
1. Signal availability to signal validation: How long does it take to recognize that a change is material?
2. Signal validation to context readiness: How long does it take to understand the affected business exposure?
3. Context readiness to owner assignment: How long does it take to identify the accountable decision maker?
4. Owner assignment to decision: How long does evaluation and approval take?
5. Decision to execution commitment: How long does it take to translate the choice into operational action?
6. Execution commitment to confirmation: How long until relevant teams and partners can verify that the action is in motion?
Each interval should be timestamped from systems of record where possible. Manual timestamps can be used during an initial pilot, but the organization should distinguish observed data from estimates.
HOW TO BUILD AN INTERNAL BENCHMARK
Step one is to select 20–50 recent exceptions from a defined decision class. The exact sample size should reflect available evidence; no universal minimum is asserted here. Step two is to reconstruct the timeline using verified system events, messages, approvals, and operational records. Step three is to classify the delay by stage. Step four is to calculate the organization’s own median, range, and outliers. Step five is to identify which delays are structural and repeatable.
The value of the benchmark is comparative. Teams can compare decision classes, business units, lanes, regions, or time periods only when definitions and evidence are consistent. The purpose is not to create a vanity score. It is to identify where decision time is being lost.
A PRACTICAL SCORECARD
Executives can establish a scorecard with the following measures:
- percentage of material exceptions detected before the last useful decision point;
- median signal-to-owner time by decision class;
- median owner-to-decision time;
- median decision-to-execution time;
- percentage of recurring decision classes with documented authority;
- percentage of material exceptions with complete business context at first review;
- percentage of selected responses executed within the defined decision window;
- percentage of post-event reviews that identify a reusable process improvement.
These are recommended management measures, not external benchmarks. Targets should be set only after the enterprise establishes a verified baseline.
SEGMENTING LATENCY BY ROOT CAUSE
Data latency occurs when critical events or business context are unavailable, stale, inconsistent, or difficult to connect. Process latency occurs when teams rely on sequential handoffs that could be parallelized. Ownership latency occurs when authority is unclear. Approval latency occurs when thresholds are too restrictive or escalation paths are poorly defined. Execution latency occurs when decisions cannot be translated rapidly into system actions, partner instructions, or operational commitments.
This taxonomy prevents leaders from prescribing a technology solution for every delay. Some problems require better data. Others require redesigned authority, playbooks, integrations, or operating routines.
THE EXECUTIVE RESEARCH AGENDA
A mature decision-readiness program should answer five questions with evidence. Which decision classes consume the most time? At what stage is that time consumed? Which delays correlate with lost operational options? Which data elements are repeatedly missing at the moment of decision? Which response playbooks reduce execution time without creating unacceptable risk?
Over time, these questions create a research loop. Every material exception becomes evidence that can improve the operating model.
IMPLICATIONS FOR TECHNOLOGY INVESTMENT
Technology should be evaluated by the latency it removes. A visibility platform may create value by moving signal availability earlier. A data platform may reduce context assembly. AI may reduce triage and scenario-analysis time. Workflow tools may reduce ownership and approval delays. Execution integrations may shorten the final mile from decision to action.
This creates a more disciplined business case. Instead of asking whether a platform provides “real-time visibility,” leaders can ask whether it measurably increases the usable decision window for high-value decisions.
HOW DECISION LATENCY IMPROVES VISIBILITY AND AWARENESS
Decision latency is more than an internal efficiency measure. It gives leaders a way to make invisible operating friction visible. A conventional dashboard can show what is happening in the network, but it rarely shows how much time the organization is consuming after the signal arrives. By exposing that interval, leaders can see whether the real constraint is detection, context, ownership, approval, or execution.
That matters for awareness because executives often see the outcome of delay without seeing its structure. A late shipment, constrained lane, missed customer commitment, or costly recovery action appears as an operational problem. The decision-latency lens asks a more useful question: at what point did the organization still have meaningful options, and where was that option window lost? The answer creates a sharper management conversation than a broad call for more resilience or more real-time visibility.
The same framework improves communication across functions. Planning may describe a forecast deviation, logistics may describe a capacity issue, customer teams may describe a service exposure, and finance may describe a cost implication. Decision latency creates a shared timeline that connects those perspectives without forcing every function into the same system.
FROM METRIC TO MANAGEMENT ROUTINE
A useful benchmark should change operating behaviour. Decision-latency reviews should be built into recurring exception and performance routines rather than treated as a one-time research exercise. Leaders can begin with a small number of high-value decision classes and ask the same five questions after every material event: When did a reliable signal first exist? When did the organization recognize its business significance? When was an accountable owner engaged? When was the decision made? When was the chosen action actually committed?
These questions turn anecdote into evidence. Over time, repeated patterns become visible. One decision class may lose time because data is fragmented. Another may lose time because authority is unclear. A third may make decisions quickly but struggle to execute across partners or systems. The organization can then invest against the actual source of delay rather than assuming every response problem requires a new platform.
A VISIBILITY-FIRST RESEARCH AGENDA
Organizations seeking greater visibility should use this framework to sharpen the questions they bring to technology, logistics, and transformation partners. Instead of asking whether a solution offers more visibility, ask which decision interval it shortens. Instead of asking whether data is real time, ask whether it arrives before the last useful decision point. Instead of asking whether AI can automate a workflow, ask whether it can reduce a specific form of search, synthesis, scenario, or documentation latency without weakening accountability.
This reframing connects technology features to executive outcomes. Supply chain leaders do not need another abstract claim that volatility is increasing. They need a way to understand why some organizations can act while options remain and others discover the same information after the network has become constrained.
WHAT LEADERS SHOULD LOOK FOR NEXT
As organizations establish a baseline, four patterns deserve attention. First, look for signals that consistently arrive early but do not trigger action; these indicate a context or ownership problem. Second, look for decisions that repeatedly require the same manual data reconstruction; these indicate a reusable data-layer opportunity. Third, look for approvals that regularly occur after options have narrowed; these indicate authority design misaligned with operating reality. Fourth, look for decisions made on time but executed late; these indicate execution dependencies are not sufficiently connected to the decision process.
EXECUTIVE TAKEAWAY
The most valuable benchmark is not an external league table. It is a verified internal view of how quickly the organization turns meaningful change into coordinated action. That view creates awareness of hidden latency, gives leaders a common language for improvement, and provides a disciplined way to evaluate data, AI, workflow, and logistics investments against the response time they actually improve.
BENCHMARKING THE QUALITY OF AWARENESS
Decision latency becomes more useful when leaders distinguish between seeing an event and understanding its decision significance. A signal may be visible in a control tower or dashboard while the business meaning remains unclear. The organization may know that a shipment is delayed, capacity is tightening, or demand has changed, yet still lack a shared view of which customer commitments, inventory positions, production requirements, or cost exposures are affected. That gap should be measured as context latency rather than treated as an unavoidable part of operations.
A practical awareness benchmark can therefore track the percentage of material exceptions that arrive at the first decision review with complete minimum context. The definition of minimum context should be specific to the decision class. For a routing decision, it might include affected orders, customer priority, inventory alternatives, capacity options, service impact, and the latest useful decision point. For an inventory decision, it might include demand exposure, available stock, replenishment timing, customer commitments, and cross-location alternatives. The objective is not to collect every possible field. It is to identify the smallest trusted set of information that allows the accountable owner to understand the trade-off.
WHY BASELINES SHOULD BE SEGMENTED
A single enterprise-wide decision-latency number can be misleading. Different decisions operate on different clocks. A routine transportation exception may need to be resolved in minutes or hours, while a supplier-capacity decision may unfold over days. The benchmark should therefore be segmented by decision class, geography, flow type, or business consequence where those distinctions are supported by evidence.
Segmentation also helps leaders identify where structural improvement is possible. If one region consistently assembles context faster than another for the same decision class, the difference may reveal reusable practices in data integration, ownership design, or partner coordination. If one decision class has low ownership latency but high execution latency, leaders can focus on workflow and system dependencies instead of changing the governance model.
FROM BASELINE TO IMPROVEMENT CYCLE
The benchmark should operate as a learning loop. After each review period, leaders can select the largest recurring source of latency and redesign one part of the process. If signals arrive late, the improvement may involve earlier origin milestones or better partner data. If context is slow, the work may focus on connecting shipment, order, inventory, and customer data. If ownership is slow, authority and escalation rules may need clarification. If execution is slow, the organization may need predefined response playbooks or stronger integration with operational systems.
The next measurement period should test whether the intervention changed the relevant interval. This keeps transformation grounded in verified operating evidence. Rather than declaring a visibility, AI, or workflow initiative successful because it was deployed, the organization can ask whether it reduced the specific form of latency it was intended to address.
HOW THE BENCHMARK SUPPORTS EXECUTIVE AWARENESS
For executives, the most useful output is not a dense operational report. It is a clear view of where decision time is being lost, which decision classes are most exposed, and whether response options are being preserved. A concise scorecard can show trend direction, major root causes, and the proportion of material exceptions that were recognized and acted on before the last useful decision point.
This turns supply chain responsiveness into a management conversation that is both measurable and actionable. It also creates a common language for discussions with technology providers, logistics partners, and internal transformation teams. Instead of asking whether a solution offers more real-time data, leaders can ask which latency interval it changes, for which decision class, and how that improvement will be verified.
RESEARCH INTERPRETATION
Decision latency should not be treated as a universal maturity score. Lower is not automatically better if speed is achieved by removing necessary controls, ignoring uncertainty, or pushing decisions to people without adequate authority. The research framework is designed to expose avoidable delay while preserving decision quality and accountability.
The strongest use of the benchmark is therefore diagnostic. It makes hidden response friction visible, shows where awareness fails to become action, and helps leaders prioritize the operating changes that protect meaningful choice when conditions change.
Download The Decision-Ready Supply Chain
CONCLUSION
The supply chain that responds fastest is not necessarily the one with the most alerts, dashboards, or predictive models. It is the one that converts meaningful change into coordinated action with the least avoidable latency.
Decision latency gives executives a way to make that capability visible. By measuring the full path from signal to executed action, organizations can identify where time disappears, protect more response options, and prioritize improvements grounded in operational evidence.
REFERENCES
1. APL Logistics. “ShipmentOptimiser™.” Digital forwarding platform using predictive analytics, visibility and exception alerts to support operational response. https://www.apllogistics.com/apl-logistics-launches-shipmentoptimiser/
2. APL Logistics. “Order Planning: Managing Your Supply Chain in the Age of Disruption.” May 20, 2024. https://www.apllogistics.com/2024/05/order-planning-managing-your-supply-chain-in-the-age-of-disruption
3. Port of Los Angeles. “Port Optimizer™.” Digital supply-chain information platform supporting cargo-flow visibility and planning. https://www.portoflosangeles.org/business/supply-chain/port-optimizer
4. McKinsey & Company. “Supply chains: Still vulnerable.” October 14, 2024. Research on resilience, visibility and operating response. https://www.mckinsey.com/capabilities/operations/our-insights/supply-chain-risk-survey-2024
5. Gartner. “Supply Chain Leaders Should Prioritize Advanced Data Visibility and Scenario Planning to Drive Competitive Advantage Amid Global Uncertainty.” May 19, 2025. https://www.gartner.com/en/newsroom/press-releases/2025-05-19-gartner-says-supply-chain-leaders-should-prioritize-advanced-data-visibility-and-scenario-planning-to-drive-competitive-advantage-amid-global-uncertainty
6. IntentTechPub. “The Decision-Ready Supply Chain.” Campaign page for APL Logistics, IA-168 - 26-08-001. https://intenttechpub.com/ebook/the-decision-ready-supply-chain/?mtm_campaign=APL_logistics&mtm_kwd=supply_chain_now&mtm_source=website&mtm_medium=cta_download_now&mtm_content=website&mtm_cid=IA_168_26_08_001&mtm_group=ebook&mtm_placement=marketing