
Executive Summary: Labor Cost Needs a Better Benchmark
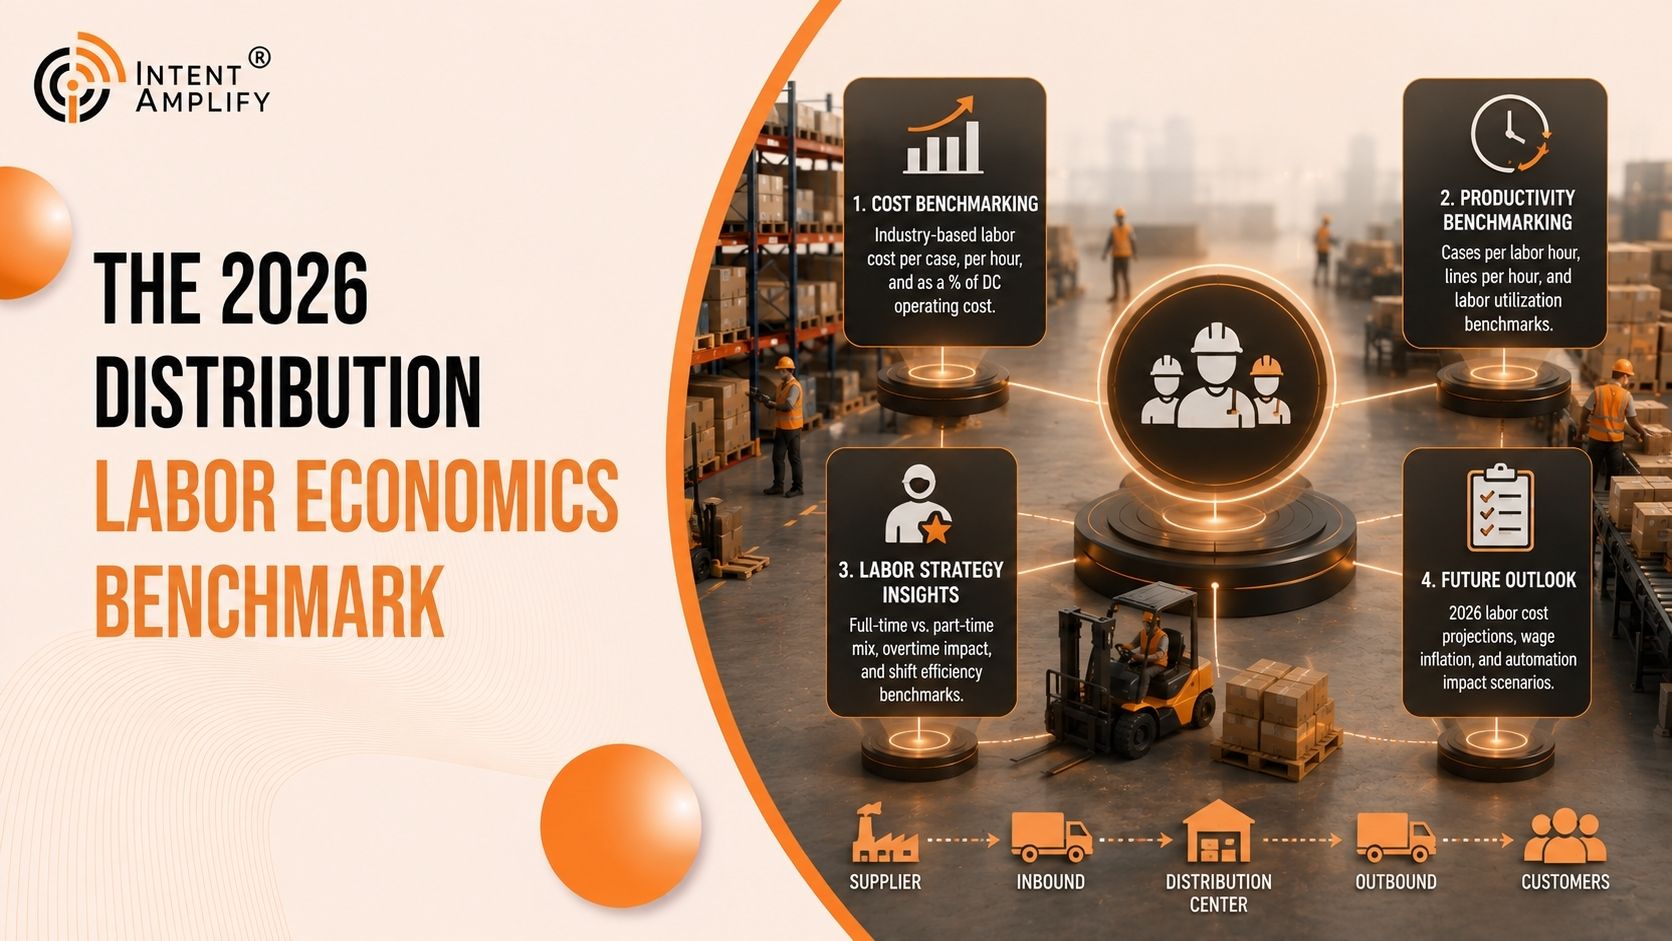
Distribution leaders are under pressure to protect service while labor remains one of the largest controllable operating costs inside a warehouse. That tension makes labor management an executive issue rather than a floor-level productivity exercise. The useful question is no longer simply whether employees can move more units per hour. It is whether the network can understand what the work should cost, why actual labor differs from that expectation, and which operating decision will close the gap without creating new service, safety, or retention problems.
The September 15 Supply Chain Now webinar centers on a durable idea: labor is a margin decision. That framing matters because labor performance sits at the intersection of demand, process design, staffing, standards, supervision, technology, and customer commitments. A strong management system therefore needs both operational evidence and financial context. It should help leaders distinguish a harder workload from weaker execution, necessary indirect work from avoidable friction, and a temporary demand spike from a structural labor problem.
This asset is written for VPs and Directors of distribution, warehousing, logistics, fulfillment, supply chain, and operations across multi-site 3PL, wholesale distribution, manufacturing, retail and consumer brands, e-commerce fulfillment, and food-and-beverage networks. It does not treat a registration, dashboard, or isolated productivity gain as proof of business value. The objective is to create a decision framework leaders can use before the next staffing, cost, technology, or network review.
The content intentionally separates management principles from vendor-specific performance claims. Any ROI, savings, or customer outcome should be verified against the cited source and the organization's own operating baseline before publication or investment approval.
This report is a measurement framework, not a claim that one universal labor benchmark applies to every distribution network. Facilities differ by channel, product, automation, labor market, customer profile, service promise, and operating model. The benchmark becomes credible when it standardizes definitions while preserving those differences in the interpretation.
Research Question: What Should a Warehouse Labor Benchmark Explain?
A benchmark is valuable only if it makes unlike situations interpretable. For distribution labor, that means defining the unit of analysis before comparing results: facility, process, shift, employee cohort, customer, order profile, or workload class. Without that denominator, a network average can hide both excellent execution and structural complexity.
The benchmark should also preserve distribution, not only averages. Median performance, range, high-consequence exceptions, overtime concentration, and the share of time that cannot be confidently classified often tell executives more than a single network-wide productivity number.
For research reporting, disclose the denominator, observation window, exclusions, and material confounders next to the finding. A 3PL customer mix shift, new automation, peak season, a facility move, or a labor-market shock can change results independently of management performance. The report should preserve those conditions rather than forcing a clean but misleading benchmark.
Recent Easy Metrics materials reinforce the need for workload-adjusted comparison. TCTS is described as a way to compare cost performance while accounting for order profile, process complexity, product mix, and workflow variability. That is an important research principle: a benchmark should normalize what can be normalized and disclose what cannot.
Benchmark One: Fully Loaded Labor Cost
Fully loaded labor cost should include more than base wages. Premium pay, overtime, payroll burden, temporary labor, supervision where appropriate, and other labor-related costs can change the economics of a shift or process. The exact accounting treatment varies by organization, so the benchmark should document inclusions rather than imply universal comparability.
The useful comparison is actual labor cost against an expectation linked to observed work. A static annual budget is important for planning, but it is weak evidence for diagnosing a day when volume, order mix, or customer requirements changed materially.
Cost definitions should be controlled centrally enough for network comparison but transparent enough for Finance to reconcile. If one facility includes temporary-labor premiums and another does not, the comparison is not decision-ready. A data dictionary is therefore part of the benchmark, not administrative overhead.
Executive questions
- What is included in fully loaded labor cost?
- Is actual spend being compared with a workload-aware expectation?
Benchmark Two: Productivity Against Workload Complexity
Productivity measures output relative to input, but the output definition matters. Units per hour can be practical for a stable process; it becomes less explanatory when travel, lines, cases, order size, or handling method vary. Multi-metric standards and workload classes can preserve the simplicity of a headline KPI while giving managers enough context to interpret it.
A strong benchmark therefore reports both performance to expectation and the composition of the work. That separation reduces the risk of rewarding easy work or penalizing facilities carrying more complex demand.
Use both central tendency and dispersion. A median may improve while the tail of severe delays worsens. Executives should know whether improvement is broad-based, concentrated in one shift, or offset by a small group of high-cost cases.
Benchmark Three: Overtime and Schedule Variance
Overtime is highly visible because it appears directly in payroll, but the root cause usually appears earlier in the operating day. Forecast error, late inbound flow, unbalanced staffing, excessive indirect time, weak standards, rework, absenteeism, congestion, or customer-specific exceptions can all create the extra hour. Cutting overtime without diagnosing the driver can move the cost into missed service, burnout, temporary labor, or tomorrow's backlog.
The right review starts with variance. What changed in workload, staffing, process, or execution? Which shifts repeatedly exceed expected labor? Which facilities show overtime even when volume is normal? A useful overtime metric therefore links the premium hours to the work and the reason, not just the total.
Pair overtime with backlog and service. If premium hours fall only because work is deferred or customer commitments are missed, the apparent saving is not an operating improvement.
|
Decision element |
What to establish |
|---|---|
|
Volume and mix |
Check whether the work was materially different from plan. |
|
Staffing and attendance |
Separate planned understaffing, absence, skill coverage, and late schedule changes. |
|
Process loss |
Look for waiting, rework, congestion, equipment, and handoff delay. |
|
Decision |
Choose a root-cause owner rather than setting a blanket overtime target. |
Executive questions
- Which root cause created the premium hour?
- Would cutting overtime now move cost or risk somewhere else?
Benchmark Four: Indirect and Unclassified Time
Indirect labor includes work that supports the operation without landing cleanly in the primary production measure: meetings, training, travel between assignments, cleanup, battery changes, waiting, equipment checks, problem solving, inventory support, and other non-direct activity. Some of it is necessary. Some of it is a symptom of process friction. The management problem begins when both categories are invisible or coded inconsistently.
Leaders should resist treating indirect time as waste by definition. The better approach is classification: necessary support work, controllable support work, avoidable delay, and unclassified time. That taxonomy turns a large bucket into a portfolio of decisions—staffing, process redesign, training, slotting, equipment, system configuration, or data-quality remediation.
The first goal can simply be better classification. A network often discovers enough opportunity by reducing 'unknown' time before it tries to reduce legitimate indirect work.
Benchmark Five: Cost-to-Serve and Margin Variance
Cost-to-serve extends labor analysis from time to economics. It asks what it actually costs to execute a process, fulfill a customer requirement, or operate a facility. Easy Metrics' 2026 Targeted Cost to Serve framing goes further by comparing actual cost with a workload-adjusted target, helping distinguish execution inefficiency from changes in the work itself.
For executives, the key value is decision clarity. When cost variance can be traced to customer mix, overtime, indirect time, productivity variance, or workflow complexity, the remedy becomes more specific: process improvement, staffing, pricing, contract review, or operating-model change.
Cost-to-serve is most useful when it can be drilled back to a process or workload driver. An enterprise number without a diagnostic path may be useful for reporting but weak for operations. Preserve the link from margin variance to the activity that created it.
Executive questions
- Can the cost variance be traced to a process, customer, or workload driver?
- What decision changes when complexity is included?
Benchmark Six: Multi-Site Performance Dispersion
Multi-site networks have two simultaneous needs: common governance and local context. Executives need comparable definitions of labor, cost, utilization, overtime, indirect time, and service. Local leaders need recognition that facility layouts, customer profiles, channels, product mix, automation, and labor markets can make identical productivity targets unrealistic.
The answer is not to abandon benchmarking. It is to normalize the comparison. Use common data definitions, shared financial logic, and workload-aware standards, then examine the remaining performance dispersion. That is where network leaders can identify practices worth replicating and facilities that need a different form of support.
Use peer groups where necessary. A high-velocity store replenishment DC and a highly fragmented e-commerce site may belong in the same network but not in the same raw productivity ranking.
|
Decision element |
What to establish |
|---|---|
|
Common definitions |
Use the same taxonomy for direct time, indirect time, overtime, cost, service, and workload. |
|
Local context |
Preserve facility-specific layout, channel, customer, and product differences. |
|
Normalized comparison |
Compare performance after workload complexity is represented. |
|
Transferable practice |
Document the mechanism behind a strong result before replicating it. |
Benchmark Seven: Management Response and Sustainability
A benchmark that never changes management behavior has limited value. Sustainable improvement requires response discipline: who reviews a variance, how quickly, with what evidence, and what action closes the loop. Measure the time from signal to diagnosis and from diagnosis to corrective action as part of performance maturity.
This also protects against metric gaming. When the goal is simply to hit a number, teams can move work between codes or optimize one measure at the expense of quality and service. When the goal is to explain variance and improve the system, the metric becomes a learning mechanism.
Track whether corrective actions actually change the next period. A labor program becomes self-correcting when recurring exceptions create process, standards, planning, or training changes rather than repeated explanations.
Executive questions
- How quickly does a signal become a corrective action?
- Did last period’s action change this period’s result?
A Benchmark Scorecard for Distribution Executives
A decision-ready framework should make the next action obvious. Define the business question, the eligible scope, the expected condition, the actual condition, the variance, the likely drivers, the accountable owner, and the review date. Keep contrary evidence visible. If a metric cannot tell the team what to investigate or who needs to act, it is a reporting metric rather than a management metric.
For an executive review, classify each issue into four routes: sustain what is working; remediate a known process or data gap; redesign the operating method where the model no longer fits; or defer action when evidence is insufficient. This prevents every variance from becoming a headcount or technology request.
|
Decision element |
What to establish |
|---|---|
|
Executive question |
What decision would this metric cause the team to make differently this week? |
|
Evidence owner |
Name the person responsible for the source, the interpretation, and the follow-through. |
|
Counter-signal |
Record the strongest fact that could overturn the initial conclusion. |
|
Decision date |
Set the operating forum where the variance will be reviewed and closed. |
See how Reyes Coca-Cola Bottling approached labor as a margin decision and built a more sustainable labor management practice over time.
|
Benchmark |
Executive interpretation |
Primary owner |
|---|---|---|
|
Labor cost |
Actual fully loaded cost vs workload-adjusted expectation |
Finance + Operations |
|
Productivity |
Performance to a workload-aware standard |
Operations / IE |
|
Overtime |
Premium hours plus reason code |
Operations |
|
Indirect time |
Classified support, friction, and unknown time |
Operations Excellence |
|
Cost-to-serve |
Actual vs targeted cost by process/site/customer where relevant |
Finance + Operations |
|
Network dispersion |
Comparable site variance after complexity normalization |
VP Distribution |
|
Response |
Owner, action, due date, next-period result |
Operating leadership |
Interpreting Benchmarks Without Punishing Complexity
Warehouse work is heterogeneous. Two orders can have the same unit count and radically different labor requirements because of lines, cases, travel distance, handling method, product dimensions, value-added services, or customer rules. Any fair comparison therefore needs a mechanism for representing complexity rather than averaging it away.
The executive test is simple: if two facilities swapped workloads tomorrow, would the current KPI still rank them the same way? If not, the metric is measuring both workload and execution without separating the two. That makes it weak evidence for staffing, performance management, or investment decisions.
Complexity does not excuse poor execution. Its purpose is to establish a fair expectation. Once the workload is represented, the remaining gap is more credible evidence for operational action.
Executive questions
- What changed in the work itself before performance changed?
- Can the current metric distinguish complexity from execution?
Conclusion: The Best Benchmark Changes the Next Labor Decision
Warehouse labor improvement becomes more durable when the organization stops treating labor as a monthly variance to explain and starts treating it as a daily operating system to manage. That requires trusted data, fair standards, workload context, visible indirect time, disciplined overtime review, and a common language between Operations and Finance.
Intent Amplify turns buyer signals into actionable intelligence that helps GTM teams prioritize accounts and coordinate the next move.
References
- Easy Metrics (2026), Warehouse Performance Management Platform. https://www.easymetrics.com/
- Easy Metrics (2026), Targeted Cost to Serve: Why Warehouse Cost Management Starts with the Right Question. https://www.easymetrics.com/blog/targeted-cost-to-serve-why-warehouse-cost-management-starts-with-the-right-question/
- Easy Metrics (2026), Targeted Cost to Serve launch announcement. https://www.easymetrics.com/news/easy-metrics-launches-targeted-cost-to-serve-tcts-a-new-metric-for-measuring-warehouse-cost-performance/
- Easy Metrics, Warehouse Labor Management System. https://www.easymetrics.com/warehouse-performance-management-platform/warehouse-labor-management-system/
- Easy Metrics, Setting Accurate and Defensible Labor Standards. https://www.easymetrics.com/wp-content/uploads/2021/12/Setting-Accurate-and-Defensible-Labor-Standards.pdf
- Easy Metrics, Data-Driven Labor Standards. https://www.easymetrics.com/wp-content/uploads/2023/04/Data-Driven-Labor-Standards-v9.pdf
- Inbound Logistics / Easy Metrics (2026), The Unified Warehouse Data Playbook. https://www.inboundlogistics.com/whitepapers/the-unified-warehouse-data-playbook/
- Reyes Coca-Cola Bottling, Warehouse Supervisor role description. https://jobportal.reyesholdings.com/allbusinessunit/jobs/32521?lang=en-us