
Executive Thesis
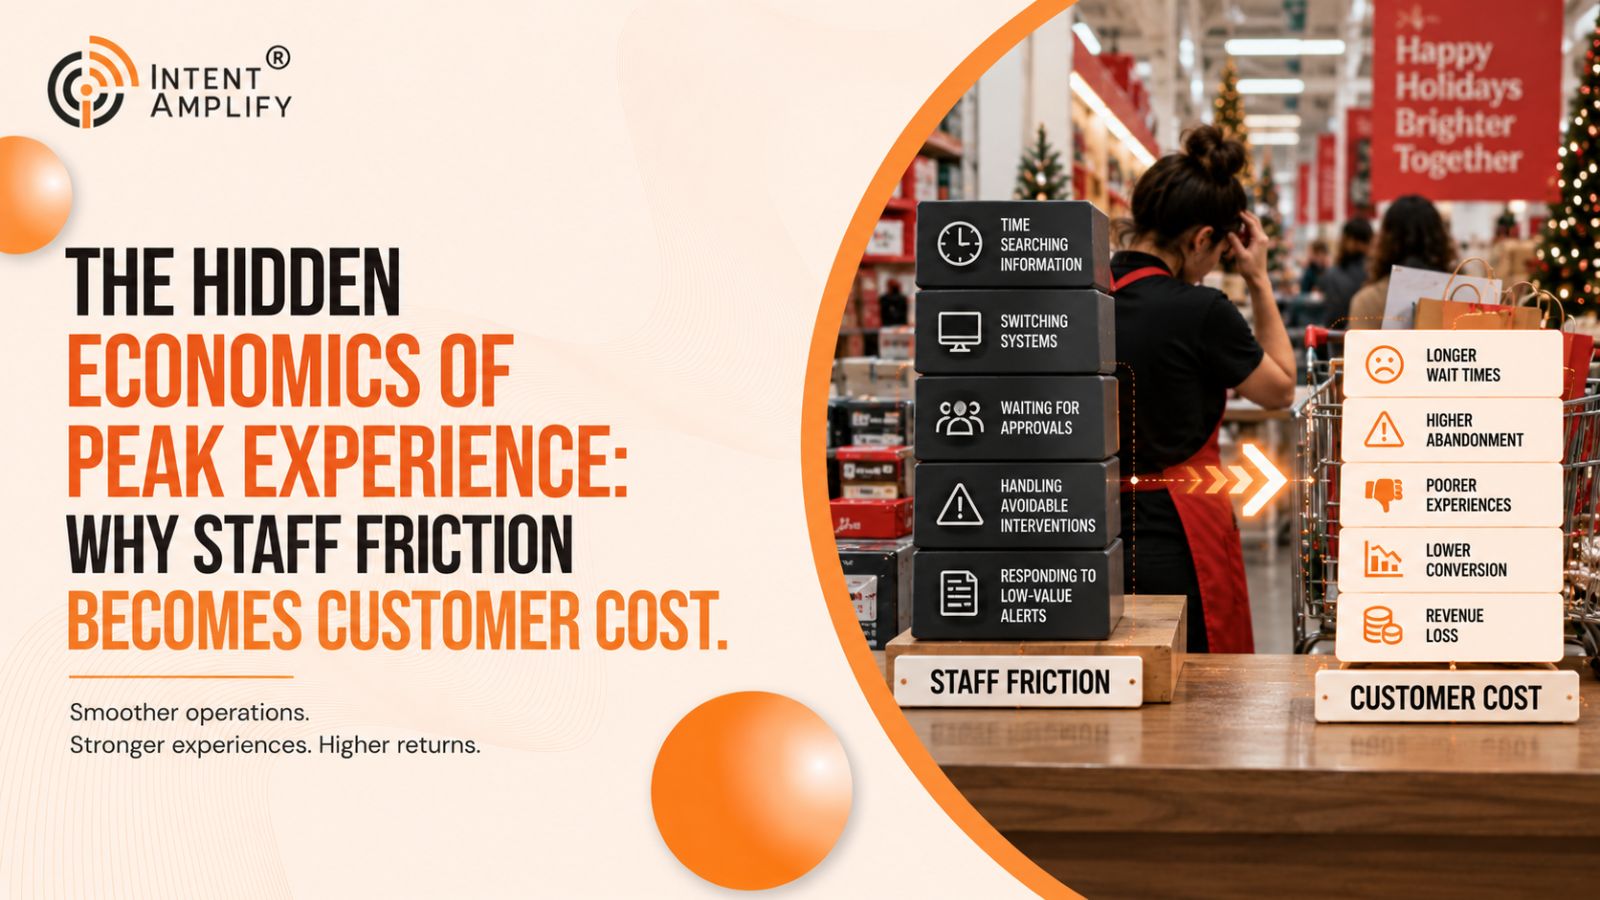
Staff friction is an operating-capacity variable. When employees spend additional time searching for information, switching systems, waiting for approval, handling avoidable interventions, or responding to low-value alerts, that time is unavailable for customers, fulfillment, replenishment, recovery, or protection work.
The evidence does not support a universal dollar value for this friction. The economic mechanism should therefore be analyzed in stages: observe the workflow, measure the capacity consumed, change the decision path, read back the operating result, and assign financial value only when verified evidence supports it.
Observation: Peak Multiplies Small Frictions
NRF forecasts U.S. retail sales growth of 4.4% in 2026 to $5.6 trillion (NRF, 2026). This does not establish the workload of any individual retailer, but it reinforces the scale of the retail environment. When demand concentrates, recurring inefficiencies repeat more often.
A small approval delay can be tolerable once and material when repeated across many interactions. A manual inventory check can be manageable at low traffic and disruptive during a pickup surge. An alert that requires a second search can consume little time individually but substantial attention when multiplied across employees and shifts.
RETHINK Retail’s holiday playbook makes staff experience one of four central pillars. That framing is economically important because staff experience affects how much operating capacity is consumed by coordination rather than customer or fulfillment work.
Interpretation: The Capacity Cost of a Decision
Every recurring decision has a time profile. An employee receives a request, finds evidence, interprets policy, acts, communicates, and closes the task. When the evidence is trusted and authority is clear, the cycle can remain short. When information is fragmented or approval is ambiguous, the cycle expands.
The economic effect appears first through capacity, not a single accounting line. Longer service time can reduce the number of customers a team can support in an interval. More manager interventions consume supervisory capacity. Manual reconciliation displaces replenishment, fulfillment, service, or protection activity. Unresolved alerts add interruption cost.
This distinction prevents an analytical error: released time is not automatically financial savings. A faster workflow may improve service capacity without changing labor expense. Financial interpretation requires evidence connecting the operating change to an economic outcome.
Implication: Manager Escalation Is a Hidden Queue
Customer queues are visible. Manager queues often are not. When employees repeatedly need approval, supervisors accumulate pending decisions while also managing staffing, incidents, service, and store conditions.
The result can cascade: the customer waits for the employee; the employee waits for the manager; the manager is interrupted from another priority; the next exception joins the same invisible queue.
A useful diagnostic is repeated escalation by exception type. If a high-frequency, low-risk condition repeatedly reaches managers, it may be a candidate for clearer policy, better evidence, or bounded delegation. If the condition involves material safety, privacy, fraud, loss, financial, or customer-impact risk, slower specialist review may remain appropriate.
Implication: Conflicting Evidence Consumes Capacity
Peak decisions become expensive when systems disagree. Inventory, order status, device health, task state, or incident information can appear differently across tools. Employees then spend time reconciling the difference.
Deloitte’s connected-store research emphasizes integration across customer, associate, and enterprise capabilities (Deloitte, 2026a). The economic implication is not that every retailer needs a new platform. A retailer can first define which source governs the immediate action, how fresh it must be, and what happens when the system value conflicts with observed reality.
That governance can reduce decision time even before major technology change. It turns evidence quality into an operating-capacity issue.
Implication: Alerts Have an Opportunity Cost
Monitoring can improve resilience, but every alert competes for attention. If recipients cannot act, priority is unclear, or multiple systems report the same condition, notification becomes operational noise.
A useful alert review asks: Which alerts changed a decision? Which were ignored? Which required a second search? Which arrived too late? Which duplicated another channel? Which created unnecessary escalation?
The objective is not simply fewer alerts. It is a higher ratio of actionable signals to interruptions. Staff attention is finite, particularly when demand is concentrated.
Implication: Automation Should Be Evaluated by Released Capacity
RETHINK Retail’s intentional-automation pillar focuses on predictable work. The strongest candidates are frequent, bounded, evidence-rich, and easy to verify.
Deloitte’s 2026 analysis of AI and frontline capacity adds a critical qualification: capacity released by technology becomes value only when work is deliberately redesigned (Deloitte, 2026e). If a task becomes faster but the employee receives more exceptions, more alerts, or another system to monitor, the net capacity effect may be smaller than expected.
A credible automation business case should therefore measure the full workflow before and after change. What manual step disappeared? What new exception appeared? How did decision time change? What did staff do with the released capacity? Did customer waiting, fulfillment, manager availability, or another operating outcome change?
Implication: Store fulfillment Creates a Capacity Trade-Off
RETHINK Retail highlights strong growth in store-fulfilled delivery. Walmart’s FY26 Q4 earnings presentation independently reported approximately 50% growth in store-fulfilled delivery, with expedited deliveries under three hours representing about 35% of store-fulfilled orders (Walmart, 2026). Its mechanism is economically relevant: store fulfillment can create value through proximity, but it also consumes inventory, labor, staging space, and employee attention.
Deloitte’s store-modernization work supports the structural role of stores as fulfillment and service assets (Deloitte, 2026b). The economic question is therefore not whether a store can technically fulfill more digital orders. It is whether the incremental workload preserves the intended service and margin outcome.
A retailer needs its own evidence to answer that question: order volume, pick time, substitution, staging, delivery cost, in-store workload, customer waiting, and margin contribution. Without those data, a retailer-specific financial conclusion remains UNKNOWN.
Implication: Recovery Time Is an Economic Variable
Failure frequency matters, but duration matters too. A device issue with a fast fallback can have limited customer impact. A small problem with an unclear owner can persist and affect more customers and employees.
Leaders can measure detection time, action time, recovery time, recurrence, and customer-facing duration for critical workflows. These measures connect technical and operating evidence. A system event becomes economically meaningful when the organization understands the scope and duration of the business impact.
Recovery design deserves economic read-back when reliable retailer data is available. The accessible public sources reviewed for this analysis did not independently substantiate the source-specific operating-income figure, so it has been removed rather than treated as a return benchmark.
A Peak Friction Cost Map
Before building a financial model, leaders can build a qualitative cost map for one workflow:
1. Friction - the recurring search, switch, approval, intervention, alert, or handoff.
2. Frequency - how often it occurs, based on observed evidence.
3. Decision time - how much employee or manager time it consumes.
4. Customer visibility - whether the delay is experienced directly by the shopper.
5. Operating dependency - which other tasks or workflows are displaced.
6. Risk boundary - whether simplification could affect safety, privacy, loss, or financial control.
7. Read-back - what changed after the workflow was redesigned.
Only after frequency and time are verified should the retailer decide whether a financial model is justified.
From Capacity Evidence to Financial Evidence
A disciplined business case separates observed facts from assumptions. Observed facts can include workflow duration, number of occurrences, manager interventions, recovery time, or customer waiting. Assumptions can include the portion of time that is avoidable, the expected effect of a change, or the financial value of released capacity.
Those assumptions should be labeled and updated after live read-back. A reduction in minutes may create value as faster recovery, more task completion, reduced waiting, or greater manager availability without creating direct labor savings.
The same caution applies to customer value. A better experience may support loyalty or conversion, but this analysis does not claim a quantified relationship. Revenue impact requires retailer-specific customer and transaction evidence.
Analyst Interpretation
Staff friction should be treated as a measurable component of peak operating capacity, not as a soft experience issue and not as an automatic savings claim. The strategic opportunity is to identify where employee time is consumed by avoidable coordination and redesign those decision paths before adding more tooling.
The evidence-first sequence is: observe the friction, verify frequency, measure decision time, redesign the workflow, measure the operating result, and only then determine whether the evidence supports a financial interpretation.
Access the full Report: The Holiday Season Playbook: Delivering Exceptional Customer and Staff Experience During Peak Trading
Sources
- RETHINK Retail and Diebold Nixdorf (2026) The Holiday Season Playbook: Delivering Exceptional Customer and Staff Experience During Peak Trading. Available at: https://intentamplify.com/landing-page/report/the-holiday-season-playbook-delivering-exceptional-customer-and-staff-experience-during-peak-trading/ (Accessed: August 25, 2026).
- Walmart Inc. (2026) FY26 Q4 Earnings Presentation. Available at: https://fortune.com/company-assets/1854/quartr/slides-ad2ae-2026-02-19-12-36-02.pdf (Accessed: August 25, 2026).
- National Retail Federation (2026) NRF Forecasts 4.4% Annual Retail Sales Growth with New Economic Model. Available at: https://nrf.com/media-center/press-releases/nrf-forecasts-4-4-annual-retail-sales-growth-with-new-economic-model (Accessed: August 25, 2026).
- Deloitte (2026a) The Connected Store. Available at: https://www.deloitte.com/us/en/Industries/consumer/articles/connected-store-retail-digital-transformation.html (Accessed: August 25, 2026).
- Deloitte (2026b) Future-proof Your Stores. Available at: https://www.deloitte.com/content/dam/assets-zone3/us/en/docs/industries/consumer/2026/future-proof-your-stores-2026.pdf (Accessed: August 25, 2026).
- Deloitte (2026c) Store Labor Modernization and Workforce Management. Available at: https://www.deloitte.com/us/en/industries/consumer/articles/retail-labor-optimization-workforce-management.html (Accessed: August 25, 2026).
- Deloitte (2026d) AI Is Freeing Up Frontline Retail Capacity. Available at: https://www.deloitte.com/ca/en/Industries/consumer/perspectives/frontline-retail-ai-capacity-value.html (Accessed: August 25, 2026).